


JETRO Invest Japan Report 2021
Chapter1. Macroeconomic and Inward/Outward Foreign Direct Investment Trends in the World and Japan Section2. FDI Trends in the World and Japan
Global Trends in Inward FDI part2
Global M&A deals declined both in number and value
According to the Workspace(Refinitiv), in 2020, cross-border mergers and acquisitions (hereafter, M&A) declined for the second consecutive year following 2019, both in number and value. The number of deals fell 15.3% to 10,070 and the value decreased 10.6% to 969 billion dollars.(Chart 1-11) (Chart 1-12).
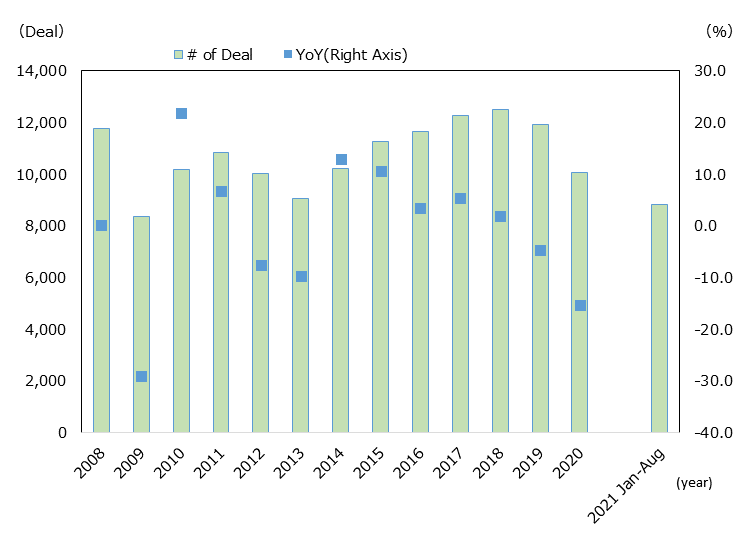
Source: "Workspace"(Refinitiv)(as of Oct.11th, 2021)
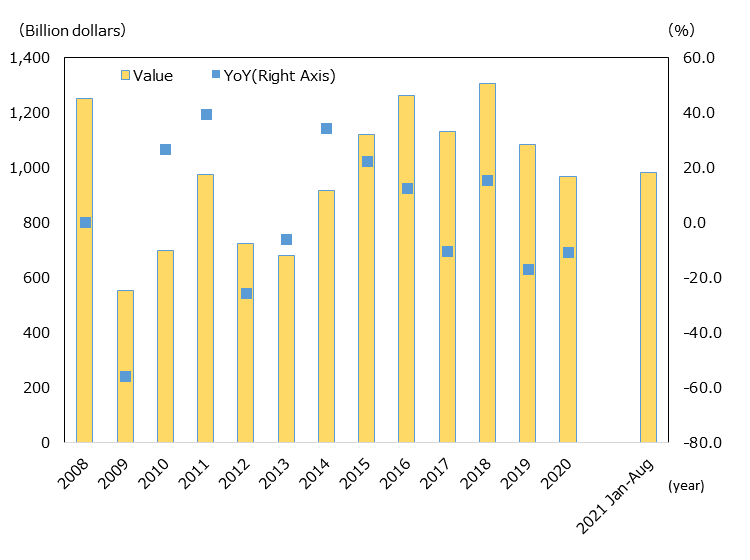
Source: "Workspace"(Refinitiv)(as of Oct.11th, 2021)
Looking at the monthly trends of M&A deals in 2020, there were 1,055 deals in January, about the same as in any other usual month (900 to 1100 deals). Then the monthly number dropped to 800s in February (822) and March (818), and further to 600s in April (669) and May (681), when the COVID-19 pandemic spread globally. Thereafter, the number gradually recovered, increasing to 950 in October and 1,067 in December. In 2021, the number of M&A deals has been robust; in the January-August period, the number of M&A deals was 39.6% higher than in the same period of the previous year.
Looking at global M&A activity in 2020 by acquirer country and region, the U.S. accounted for the largest number at 2,187 (down 4.6% from the previous year), followed by the U.K. (1,051, down 12.1%), Canada (547, down 6.5%), Germany (490, down 22.5%), and France (479, down 28.6%) (Chart 1-13).
| Ranking | Country/Region |
Change in Ranking |
# of Projects | YoY | Share |
|---|---|---|---|---|---|
| 1 | US |

|
2,187 | -4.6 | 21.7 |
| 2 | UK |
|
1,051 | -12.1 | 10.4 |
| 3 | Canada |

|
547 | -6.5 | 5.4 |
| 4 | Germany |
|
490 | -22.5 | 4.9 |
| 5 | France |

|
479 | -28.6 | 4.8 |
| 6 | Japan |
|
376 | -25.7 | 3.7 |
| — | Total | — | 11,896 | -15.3 | 100 |
The number of deals by the top five countries, which accounted for about half of the total, were all down from the previous year.
On a value basis, the U.S. accounted for the largest amount at $246 billion, up 19.2% from the previous year, followed by the U.K. ($186 billion, up 43.0%), Germany ($48 billion, down 0.3%), and Japan ($48 billion, down 65.3%).
The U.S. and U.K. saw year-on-year increases (Chart 1-14). UNCTAD analyzes and attributes the year-on-year decline of Japan's M&A, both in the number and value, to the absence of large-scale deals in 2020, which had been observable in recent years.
| Ranking | Country/Region |
Change in Ranking |
Value | YoY | Share |
|---|---|---|---|---|---|
| 1 | US |
|
246 | 19.2 | 25.4 |
| 2 | UK |
|
186 | 43.0 | 19.2 |
| 3 | Germany |
|
48 | -0.3 | 5.0 |
| 4 | Japan |
|
48 | -65.3 | 4.9 |
| 5 | China |
|
37 | -0.7 | 3.8 |
| — | Total | — | 969 | -10.6 | 100.0 |
Looking at the acquisition target by countries and regions, the U.S. recorded the largest number with 1,686 deals, up 0.0% from the previous year, followed by the U.K. (941 deals, down 10.6%), and Germany (523 deals, down 25.3%) (Chart 1-15). While the overall number fell 15.3%, those in in the top countries, including the U.S. and Canada, were almost unchanged.
| Ranking | Country/Region |
Change in Ranking |
# of Projects | YoY | Share |
|---|---|---|---|---|---|
| 1 | US |
|
1,686 | 0.0 | 16.7 |
| 2 | UK |
|
941 | -10.6 | 9.3 |
| 3 | Germany |
|
523 | -25.3 | 5.2 |
| 4 | Canada |
|
512 | -1.0 | 5.1 |
| 5 | France |
|
415 | -18.3 | 4.1 |
| 20 | Japan |
|
135 | 11.6 | 1.3 |
| — | Total | — | 10,070 | -15.3 | 100.0 |
Looking at the value, the U.S. registered 249 billion dollars, down 11.1% from the previous year. As with the number of deals, the U.S. recorded the highest figure amount all countries and regions. However, the amount declined year on year.. The Netherlands (136 billion dollars, up 442.2%), and the U.K. (74 billion dollars, down 16.8%) followed (Chart 1-16).
| Ranking | Country/Region |
Change in Ranking |
Value | YoY | Share |
|---|---|---|---|---|---|
| 1 | US |
|
249 | -11.1 | 25.7 |
| 2 | Netherlands |
|
136 | 442.2 | 14.0 |
| 3 | UK |
|
74 | -16.8 | 7.6 |
| 4 | Germany |
|
66 | 10.9 | 6.8 |
| 5 | India |
|
40 | 43.6 | 4.1 |
| 21 | Japan |
|
10 | 19.8 | 1.0 |
| — | Total | — | 969 | -10.6 | 100.0 |
Growth forecasted for 2021, with uneven recovery across regions
UNCTAD projects global inward FDI in 2021 to increase by 10 to 15% from 2020 (Chart 1-17). While the number of greenfield investments has been sluggish, M&A has been active since the second half of 2020, and this trend continues in 2021. In addition to the Asian region, where investments were solid in 2020, UNCTAD expects investments in infrastructure, digital technologies, and environment, funded by the fiscal policies launched by the EU countries and the U.S. to respond to the economic impact of COVID-19, will contribute to increasing inward FDI.
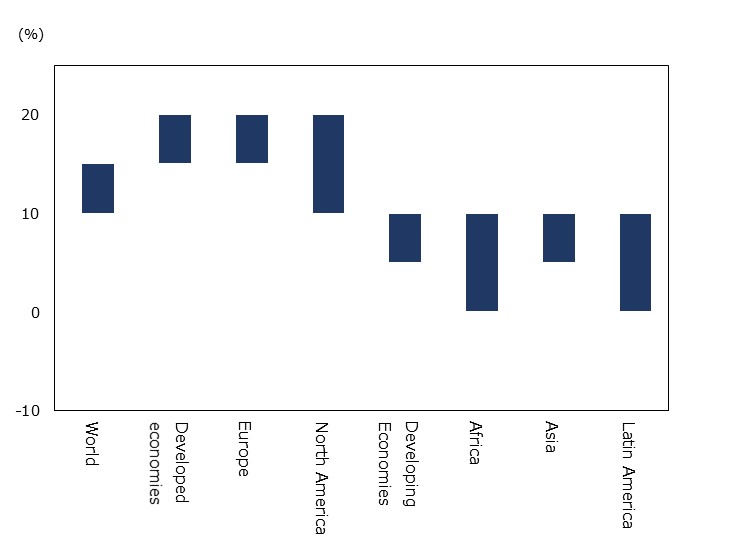
Note: Classification of each region is as defined by UNCTAD.
Source: "World Investment Report 2021" (UNCTAD)
On the other hand, UNCTAD predicts that the recovery of inward FDI will be weak in Latin American and African countries, which will continue to be significantly affected by COVID-19. There are concerns that the impact of COVID-19 variants on the world's social and economic conditions in various parts of the world may affect the forecast of global Inward FDI.
JETRO Invest Japan Report 2021
-
Chapter1.
Macroeconomic and Inward/Outward Foreign Direct Investment Trends in the World and Japan
-
Section1.
-
Section2.
-
-
Chapter2.
Japan's Business Environment and Foreign-Affiliated Companies
-
Section1.
-
Section2.
-
Section3.
-
-
Chapter3.
JETRO's Efforts to Promote Investment in Japan
-
Section1.
-
Section2.
-
お問い合わせ
フォームでのお問い合わせ
ジェトロはみなさまの日本進出・日本国内での事業拡大を全力でサポートします。以下のフォームからお気軽にお問い合わせください。
お問い合わせフォームお電話でのお問い合わせ
-
- 拠点設立・事業拡大のご相談:
- 03-3582-4684
-
- 自治体向けサポート:
- 03-3582-5234
-
- その他の対日投資に関するお問い合わせ:
- 03-3582-5571
受付時間
平日9時00分~12時00分/13時00分~17時00分
(土日、祝祭日・年末年始を除く)