


JETRO Invest Japan Report 2023
Chapter1. Inward FDI Trends in the World Section 4. Changes in Global Investment Destinations due to Geopolitical Risks
According to the survey by the International Monetary Fund (IMF), the number of investment destinations in strategic sectors (announced basis) has been on a downward trend since 2019, which is particularly significant in Asia. A slight recovery trend, however, is seen in Asia, with the exception of China (Chart 1-5).
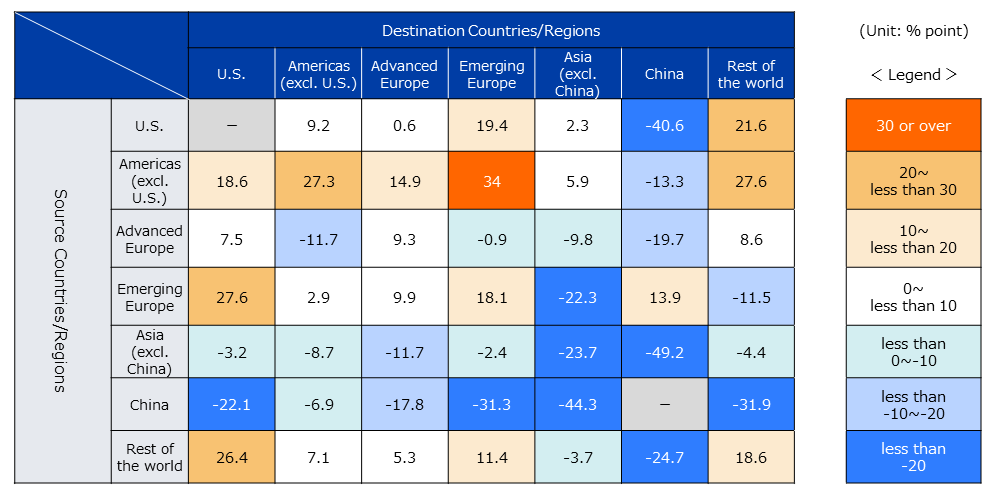
An analysis by IMF of the investment sources and destinations by region based on the number of cases suggests that China is falling significantly both as an investor and as an investee. With the exception of Emerging Europe, the analysis suggests that the importance as an investment destination from all regions has decreased (Chart 1-6).
This situation may have a major impact on companies' investment strategies in Japan.
![IMF, the International Monetary Fund surveyed the number of investment destinations, in strategic sectors in the United States, Europe, China, and Asia with the exception of China from 2015 to 2022 on an announcement basis. Strategic sectors include chemicals, pharmaceuticals, batteries, electronic devices and components, measuring instruments, automobiles, and resources, etc. It shows that the US-China trade war in 2018, the covid-19 pandemic from 2019, and Ukraine war from 2022 have greatly influenced each country's investment as geopolitical risks. The graph shows the number of investments in each country, assuming the first quarter of 2015 as 100. Following all values are preceded by [approximately]. In the United States, it showed some ups and downs, but it increased to 152, in 2019, at the third quarter. However, it decreased after 2020 and fell to 105, in 2021, at the first quarter. It then began to increase, reaching 143, in 2022, at the fourth quarter. In Europe, it peaked at 162, in 2019, at the first quarter, declined after 2020, and dropped to 114, in 2021, at the first quarter. After that, it started to increase and reached 133, in 2021, at the fourth quarter, but it decreased again from 2022, to 107, in 2022, at in the fourth quarter. In China, it continued to decline until the third quarter of 2017, reaching 68, and then rapidly increased to the peak of 117, in 2018, at the fourth quarter. After 2019, it declined again, dropping to 47, in 2020, at the fourth quarter, and returned to 57, in 2021, at the fourth quarter, but decreased again to 40, the lowest, in 2022, at the fourth quarter. In Asia, excluding China, it continued to decline until the second quarter of 2017, reaching 80, and then increased to the peak of 112, in 2018, at the second quarter, but decreased again to 50, the lowest, in 2021, at the first quarter. The graph curve was like that of China, but it gradually recovered to 72 in 2022.](/ext_images/en/invest/img/investment_environment/ijre/report2023/ch1/1-5.png)
-
Note *1:
Chemicals, Pharmaceuticals, batteries, electronic devices and components, measuring instruments, automobiles, resources, etc.
-
Note *2:
Based on the number of investments. Four-period moving averages with the 2015 Q1 as 100.
-
Source:
IMF World Economic Outlook (April 2023), "fDi Markets" (Financial Times)
(Comparison of Q2 2020 to Q4 2022 and Q1 2015 to Q1 2020)
-
Note:
Deviation from the change in the overall number of greenfield investments (aggregate change, -19.5%) between the two comparative periods. Note that Japan is not included here.
-
Source:
IMF World Economic Outlook (April 2023), "fDi Markets" (Financial Times)
JETRO Invest Japan Report 2023
-
Chapter1.
-
Chapter2.
-
Section1.
-
Section2.
-
Section3.
-
Section4.
-
Section5.
-
Section6.
-
[Column 1]
-
[Column 2]
-
[Column 3]
-
-
Chapter3.
-
Section1.
-
Section2.
-
Section3.
-
Section4.
-
Section5.
-
Section6.
-
Section7.
-
Section8.
-
Section9.
-
Section10.
-
お問い合わせ
フォームでのお問い合わせ
ジェトロはみなさまの日本進出・日本国内での事業拡大を全力でサポートします。以下のフォームからお気軽にお問い合わせください。
お問い合わせフォームお電話でのお問い合わせ
-
- 拠点設立・事業拡大のご相談:
- 03-3582-4684
-
- 自治体向けサポート:
- 03-3582-5234
-
- その他の対日投資に関するお問い合わせ:
- 03-3582-5571
受付時間
平日9時00分~12時00分/13時00分~17時00分
(土日、祝祭日・年末年始を除く)