


JETRO Invest Japan Report 2023
Chapter2. Trends in Inward FDI in Japan Section 1. Trends in Inward FDI to Japan
1. Flow
According to the "Balance of Payments" (asset and liability principle) of the Ministry of Finance (MOF) and Bank of Japan (BOJ), FDI flow to Japan in 2022 increased significantly by 68.6% year-on-year to 6.5 trillion yen (Chart 2-1). Looking at this by type of capital, equity capital increased 4.2% year-on-year to 2.7 trillion yen, reinvestment of earnings rose 18.3% year-on-year to 1.9 trillion yen, while debt instruments, which represent the lending and borrowing of funds between enterprises in capital ties, turned positive at 1.8 trillion yen from -0.4 trillion yen in the previous year. Equity capital, which reached a record high in 2021, continued to increase in 2022, and economic activities continue to develop for new investments and capital increases in Japan.
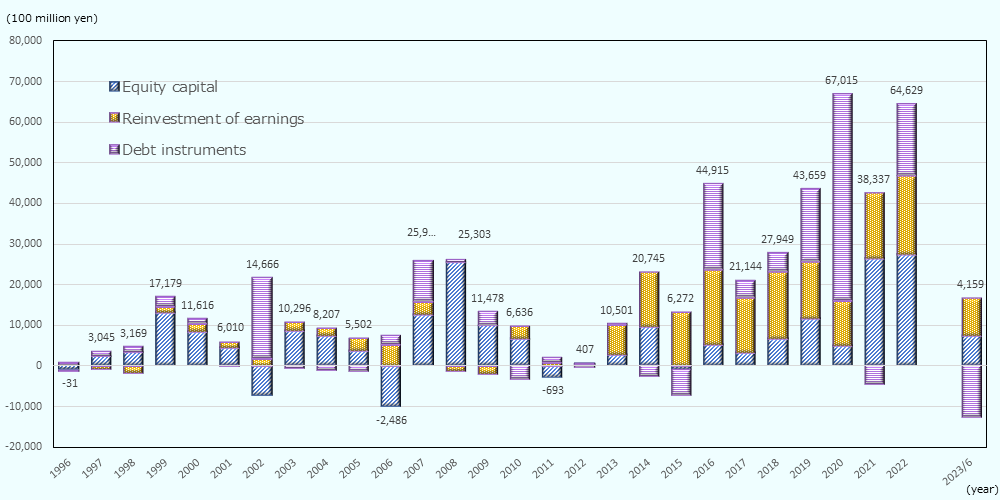
Note: The figures before 2013 are calculated based upon a different principle.
Source: “Balance of Payments” (MOF, BOJ)
2. Stock
At the end of 2022, the FDI stock in Japan (asset and liability principle) was 46.2 trillion yen, up 13.5% from the previous year, and the ratio in relation to nominal GDP was 8.3%. As of the second quarter of 2023, the FDI stock had gradually increased to 47.3 trillion yen.
Looking at the FDI stock in Japan at the end of 2022 (asset and liability principle) by type of capital, equity capital increased 10.4% year-on-year to 23.7 trillion yen, reinvestment of earnings increased 8.0% year-on-year to 7.9 trillion yen, and debt instruments increased 22.4% year-on-year to 14.6 trillion yen. Reflecting the debt instruments turning positive as mentioned earlier, the share of debt instruments in the stock increased to 31.6% at the end of 2022 from 29.2% at the end of 2021 (Chart 2-2).
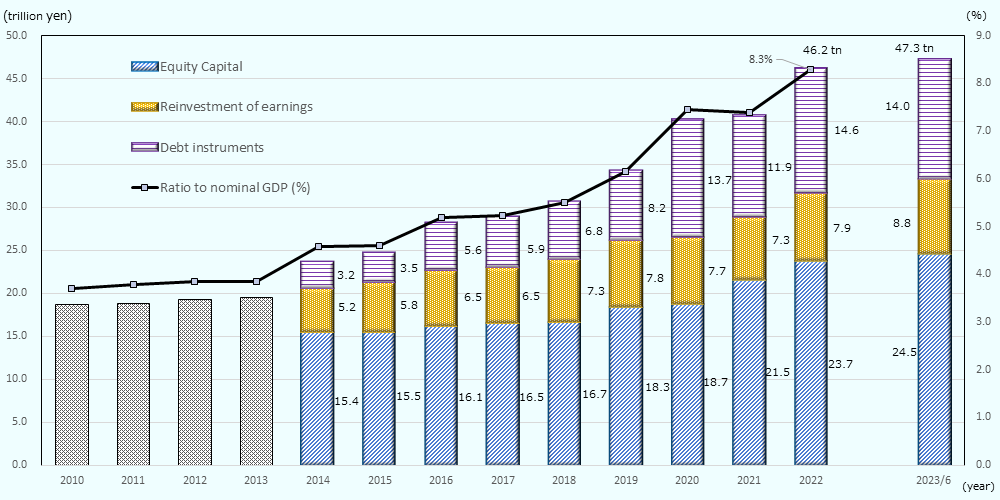
Note: Breakdown of stock in 2013 and before is not disclosed.
Source: "International Investment Position of Japan" (MOF, BOJ), "National Accounts of Japan" (Japan Cabinet Office)
JETRO Invest Japan Report 2023
-
Chapter1.
-
Chapter2.
-
Section1.
-
Section2.
-
Section3.
-
Section4.
-
Section5.
-
Section6.
-
[Column 1]
-
[Column 2]
-
[Column 3]
-
-
Chapter3.
-
Section1.
-
Section2.
-
Section3.
-
Section4.
-
Section5.
-
Section6.
-
Section7.
-
Section8.
-
Section9.
-
Section10.
-
お問い合わせ
フォームでのお問い合わせ
ジェトロはみなさまの日本進出・日本国内での事業拡大を全力でサポートします。以下のフォームからお気軽にお問い合わせください。
お問い合わせフォームお電話でのお問い合わせ
-
- 拠点設立・事業拡大のご相談:
- 03-3582-4684
-
- 自治体向けサポート:
- 03-3582-5234
-
- その他の対日投資に関するお問い合わせ:
- 03-3582-5571
受付時間
平日9時00分~12時00分/13時00分~17時00分
(土日、祝祭日・年末年始を除く)