


JETRO Invest Japan Report 2023
Chapter2. Trends in Inward FDI in Japan Section 2. Trends in Inward FDI to Japan by Country and Region
1. Flow
Breaking down FDI flow to Japan (asset and liability principle) in 2022 by region, North America accounted for the highest amount at 2.0 trillion yen, up 73.2% from the previous year, followed by Europe at 1.9 trillion yen, recovering from -0.8 trillion yen in 2021, and Asia at 1.8 trillion yen, down 27.2% from the previous year (Chart 2-3). In North America, which was the largest, the U.S. increased by 25.9% from the previous year to 1.4 trillion yen, making it the largest among all countries and regions in the world. Canada increased significantly to 0.6 trillion yen from 50 billion yen in 2021. In Europe, the second largest by country and region, negative net inflow in 2021 turned to be positive, as mentioned above, with the U.K. at 1.1 trillion yen, Switzerland at 0.4 trillion yen, and France at 0.2 trillion yen. In Asia, Singapore decreased -1.1% year-on-year to 0.8 trillion yen, Hong Kong saw a significant decrease to 0.4 trillion yen from 1.3 trillion yen in 2021, and Taiwan increased to 0.2 trillion yen from 25 billion yen in 2021 (Chart 2-4).
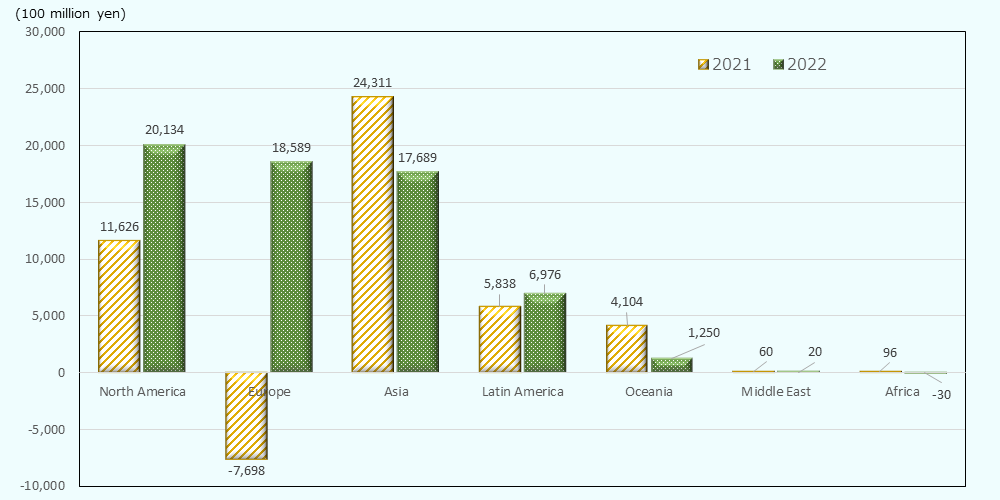
Source: "Balance of Payments" (MOF, BOJ)
| Ranking | Investor Country/ Region | 2022 | 2022 Growth rate (YoY) | 2022 Share |
|---|---|---|---|---|
| 1 | United States | 14,000 | 25.9 | 21.7 |
| 2 | United Kingdom | 11,252 | * | 17.4 |
| 3 | Singapore | 8,434 | -1.1 | 13.1 |
| 4 | Cayman Islands | 6,247 | 13.4 | 9.7 |
| 5 | Canada | 6,134 | 1,118.8 | 9.5 |
| 6 | Switezerland | 3,911 | * | 6.1 |
| 7 | Hong Kong | 3,523 | -73.5 | 5.5 |
| 8 | France | 1,939 | -24.9 | 3.0 |
| 9 | Taiwan | 1,835 | 638.4 | 2.8 |
| 10 | Australia | 1,723 | -44.4 | 2.7 |
| — | World | 64,629 | 68.6 | 100.0 |
2. Stock
Looking at the FDI stock at the end of 2022 (asset and liability principle), Europe was the largest at 19.8 trillion yen and accounted for 42.8% of the total, followed Asia and North America at 11.1 trillion yen (24.1% of the total) (Chart 2-5). In Europe, the overall composition ratio fell slightly from the previous year's ratio of 44.0% due to the decline in stock in the Netherlands (down 14.7% year-on-year) and sluggish growth in France (up 2.0% year-on-year). By country and region, the U.S. was the largest at 10.3 trillion yen (22.3% of the total), followed by the U.K. at 7.7 trillion yen (16.7% of the total) (Chart 2-6). The top 10 countries/regions accounted for 84.9% of the total FDI stock in Japan and were mainly taken up by Europe and Asia other than the U.S.
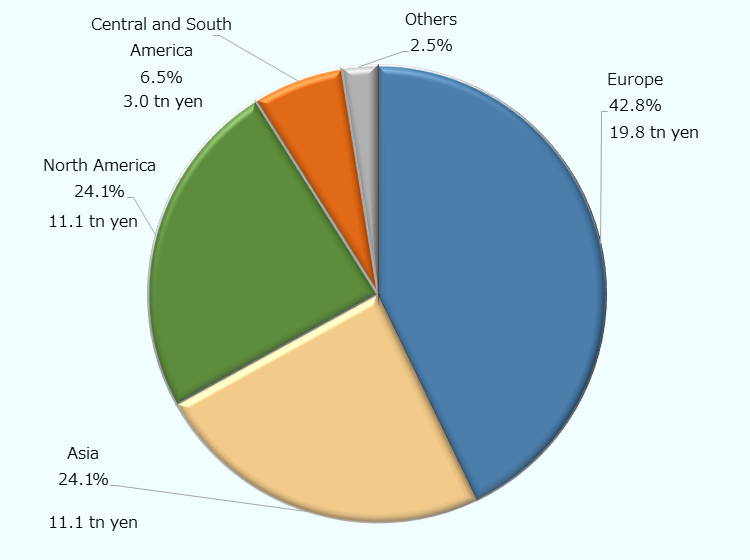
Source: "International Investment Position of Japan" (MOF,BOJ)
| Ranking | Country/ Region | Stock | Growth rate (YoY) | Ratio |
|---|---|---|---|---|
| 1 | United States | 102,789 | 12.2 | 22.3 |
| 2 | United Kingdom | 76,966 | 36.3 | 16.7 |
| 3 | Singapore | 48,232 | 28.4 | 10.4 |
| 4 | Netherlands | 33,894 | -14.7 | 7.3 |
| 5 | France | 32,309 | 2.0 | 7.0 |
| 6 | Hong Kong | 26,187 | -5.4 | 5.7 |
| 7 | Cayman Islands | 24,990 | 43.0 | 5.4 |
| 8 | Switzerland | 21,744 | 11.2 | 4.7 |
| 9 | Germany | 13,940 | 13.9 | 3.0 |
| 10 | Taiwan | 10,733 | 19.6 | 2.3 |
| — | Others | 69,896 | 9.4 | 15.1 |
| — | Total | 461,680 | 13.5 | 100.0 |
JETRO Invest Japan Report 2023
-
Chapter1.
-
Chapter2.
-
Section1.
-
Section2.
-
Section3.
-
Section4.
-
Section5.
-
Section6.
-
[Column 1]
-
[Column 2]
-
[Column 3]
-
-
Chapter3.
-
Section1.
-
Section2.
-
Section3.
-
Section4.
-
Section5.
-
Section6.
-
Section7.
-
Section8.
-
Section9.
-
Section10.
-
お問い合わせ
フォームでのお問い合わせ
ジェトロはみなさまの日本進出・日本国内での事業拡大を全力でサポートします。以下のフォームからお気軽にお問い合わせください。
お問い合わせフォームお電話でのお問い合わせ
-
- 拠点設立・事業拡大のご相談:
- 03-3582-4684
-
- 自治体向けサポート:
- 03-3582-5234
-
- その他の対日投資に関するお問い合わせ:
- 03-3582-5571
受付時間
平日9時00分~12時00分/13時00分~17時00分
(土日、祝祭日・年末年始を除く)